To run RFAssistant, click on the link below. Be aware, however, that Java Web Start will give you a security warning that the code is signed by "William R. Frensley," but that it cannot verify this and it will recommend that you do not run this program. What this means is that I have not paid a few hundred dollars per year for a verified security certificate. Note that the code is being served from the University of Texas at Dallas web site, and that I am a Professor at UT-Dallas and make your own judgement about the safety of this code.
When RFAssistant launches, you will see the a screen like the
following
figure, but the graph will be blank. The first thing that must be
done is to read in an S-parameter file. If you don't have such a
file downloaded on your computer already, copy the following URL,
select
"Open URL" from the "File" menu, and paste the text into the dialog box
that asks you to enter the URL.
http://www.utdallas.edu/~frensley/courses/EE4368/FHX13X_FHX14X.s2p
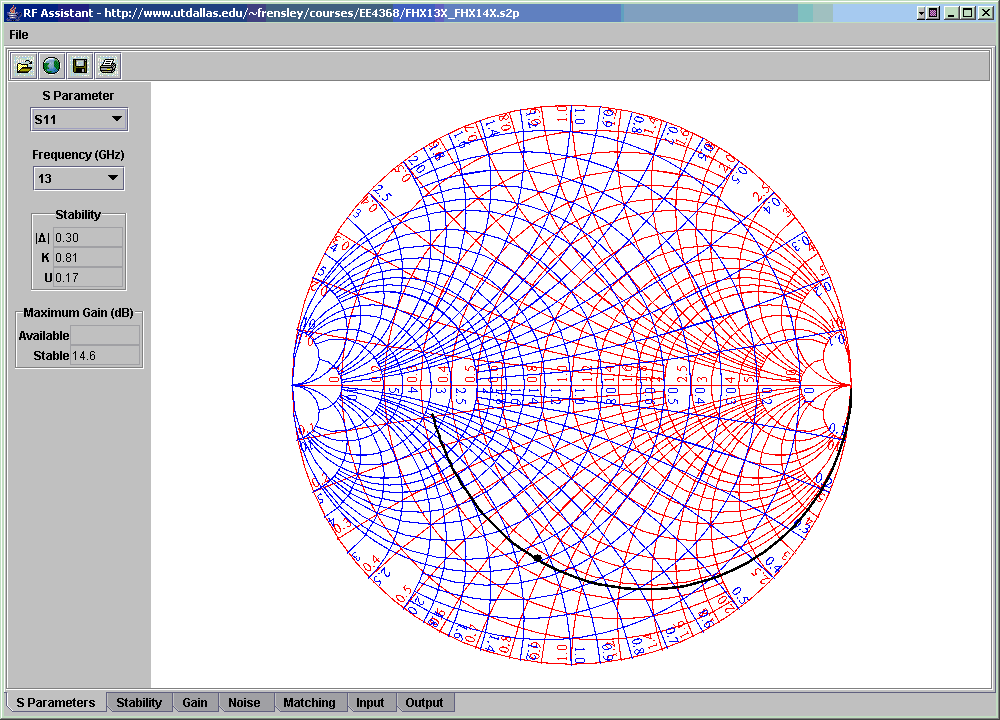
Now you can select an S-parameter to plot from the choice box at the
top of the left-hand panel. You should see a display like
the
following:

Selecting a frequency (from the set for which data was available) causes the S-parameter at that frequency to be marked with a black dot.
Clicking on the "Stability" tab at the bottom of the frame takes you to a plot of various stability-related factors as a function of frequency:
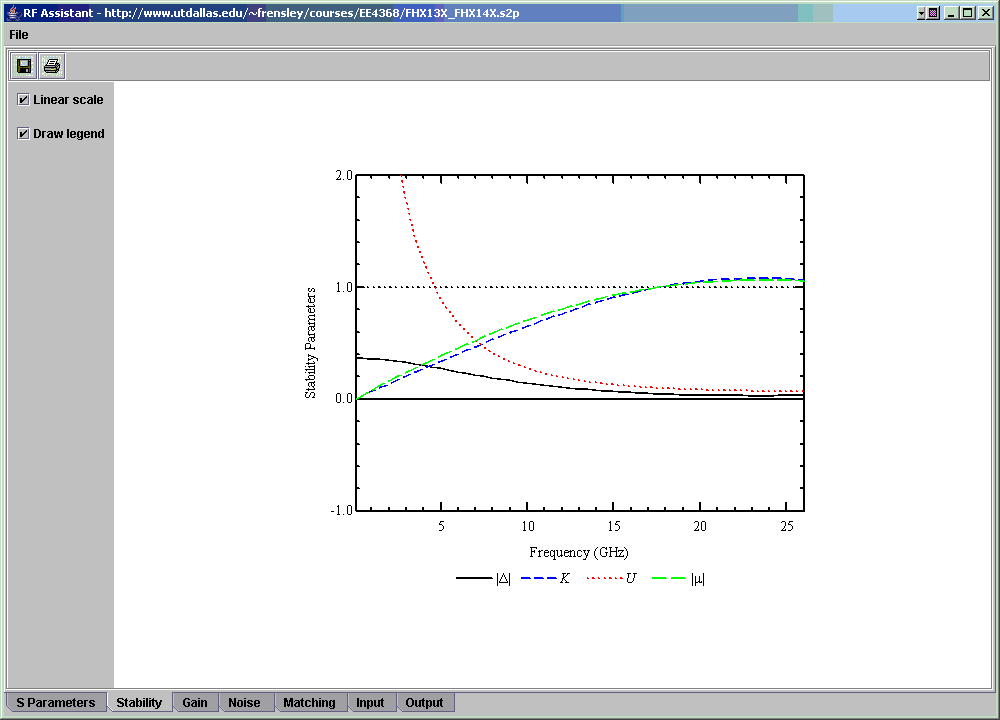
Delta is the determinant of the S-matrix, K is the Rowlett stability factor, and U is the unilateral figure of merit. Mu is the stability factor proposed by Edwards and Sinsky in IEEE Transactions on Mircowave Theory and Techniques, Vol. 49, pp. 2303-11 [1992]. In general, the transistor will be unconditionally stable if K or mu is greater than 1.
Clicking on the "Gain" tab produces a display of the maximum gain as a function of frequency:
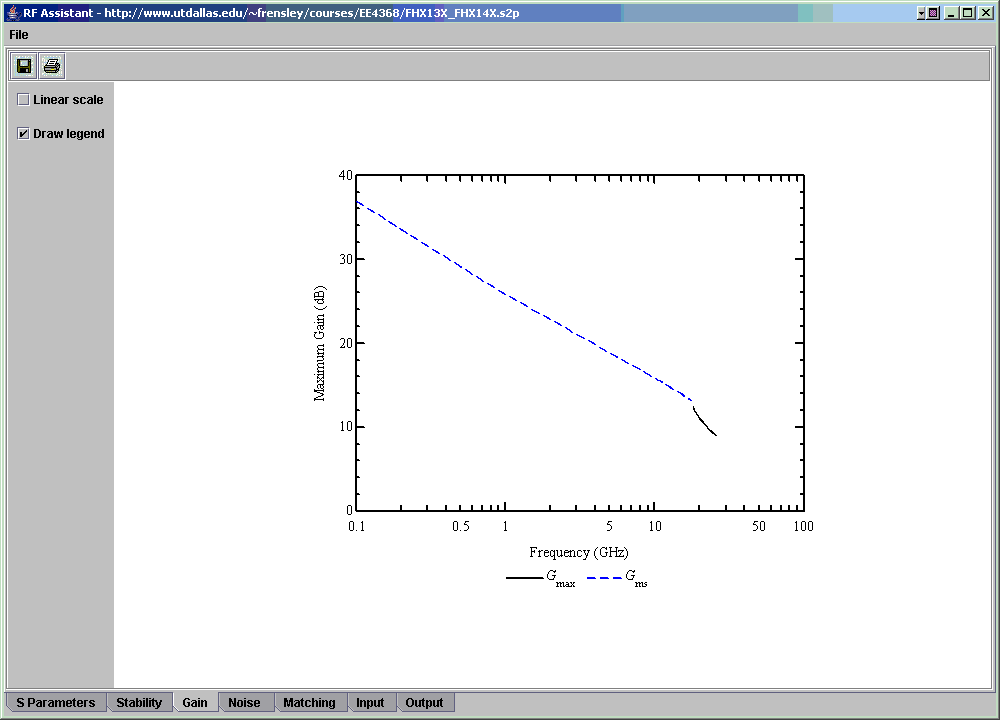
Gmax is the maximum available gain, Gms is the maximum stable gain.
Clicking on the "Noise" tab produces a plot of the minimum noise figure versus frequency (if the .s2p file contains noise data):
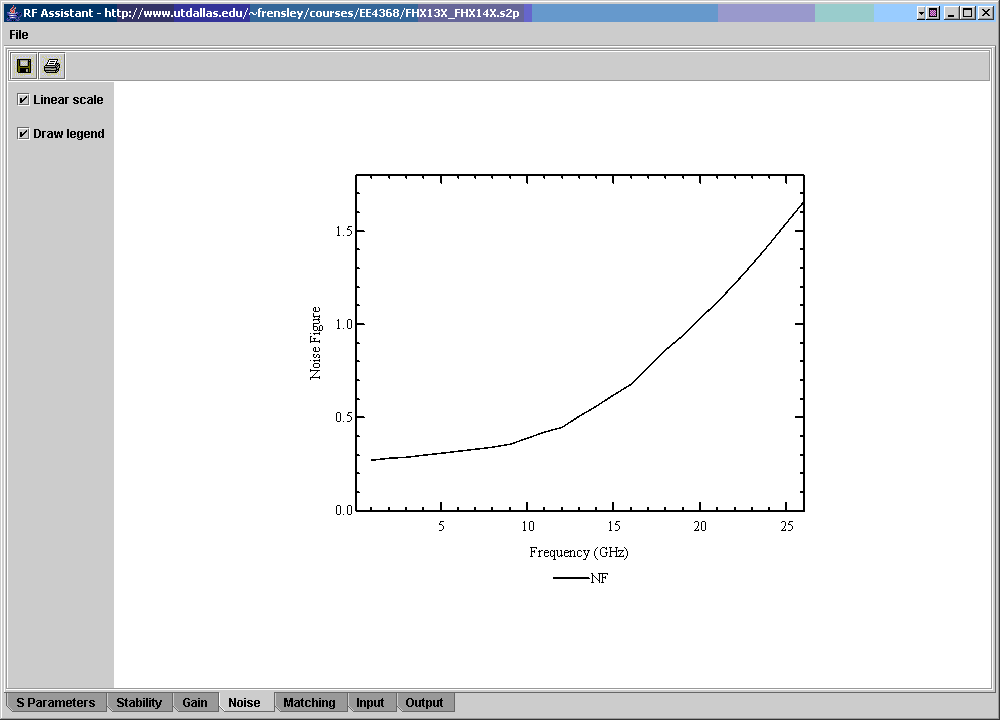
Clicking on the "Matching" tab produces this display:
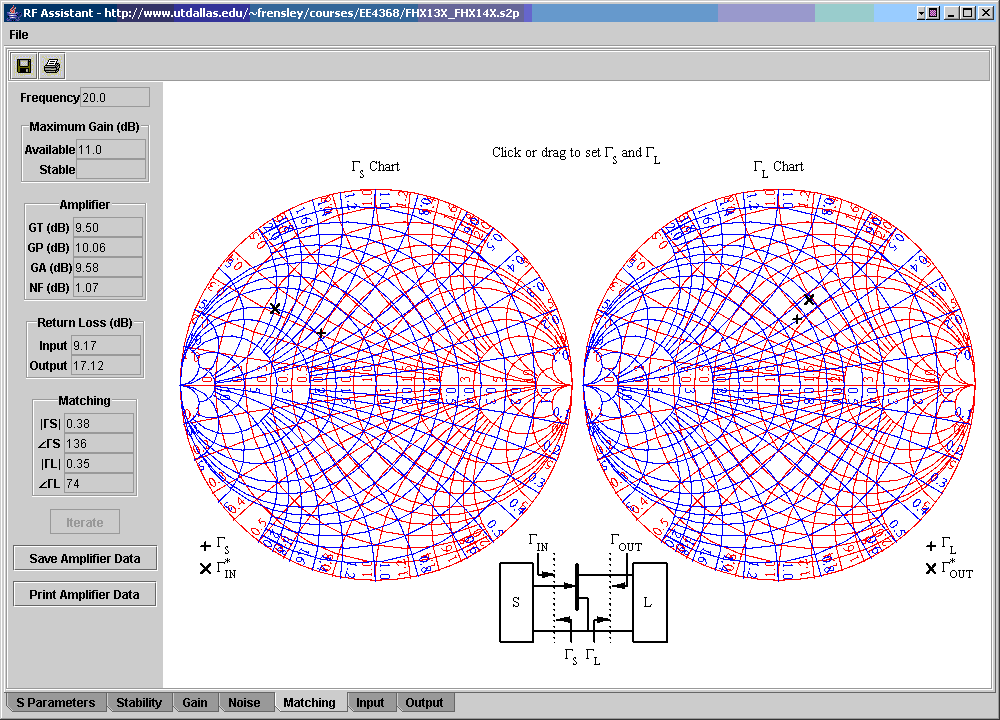
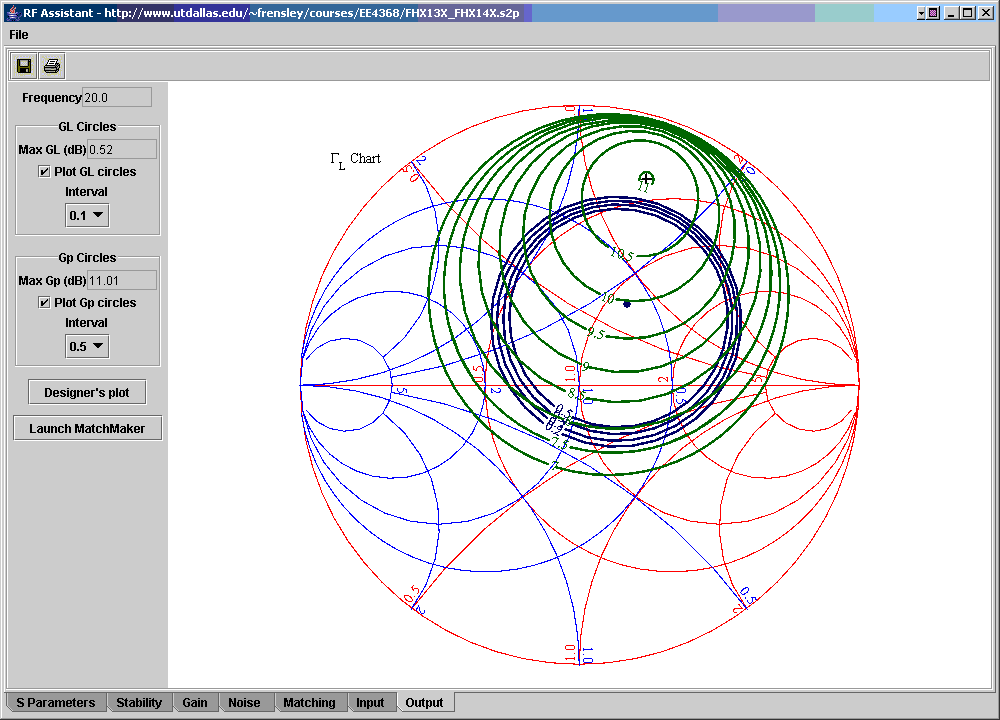
This is probably the most informative display in RFAssistant. It lets you visualize and understand the interaction between the input and output conditions in a linear two-port network (typically a transistor). Notice the circuit diagram at the bottom of the display. It is the guide to the meanings of the quantities displayed on the Smith charts. The chart to the left shows quantities on the input side. Clicking and dragging on this chart changes the value of Gamma S, indicated by the "+" mark. When you change this, you will notice that the "X" mark on the right-hand display also moves. This shows Gamma OUT*. A "simultaneous conjugate match" is achieved when we can get Gamma S = GammaIN* and GammaL = GammaOUT* at the same time. However to do this, the transistor has to be unconditionally stable. Our example transistor is stable above about 18 GHz. (You will need to change the frequency on the "S Parameters" tab.) At a frequency of 20 GHz (as shown in the figure) you can alternately move GammaS to chase after GammaIN* and move GammaL to chase after GammaOUT*. When they get close enough, the "Iterate" button on the left-hand panel becomes active, and you can simply press it a number of times to automate this process.
The "Input" tab produces a display which looks like this:
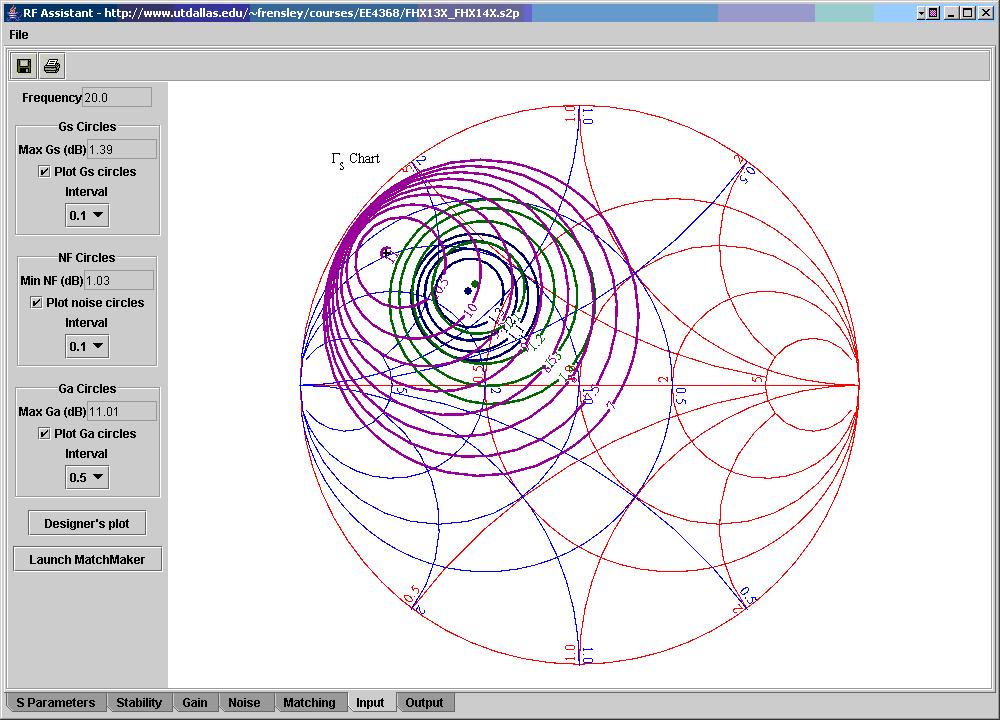
This is a plot in the GammaS plane with more information displayable. In particular, several sets of "design circles" can be displayed. These are controlled in the left-hand control panel, in the boxes labeled "Gs Circles," "NF Circles," and "Ga Circles." In each case the plotting of the set is controlled by a check box, and the contour interval is selectable from a choice box.
