 |
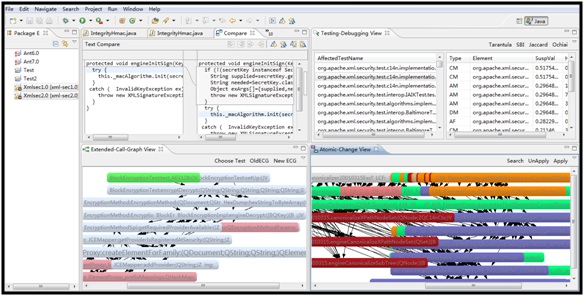
| Figure 1. FaultTracer overview |
FaultTracer is a change impact and regression fault analysis tool for evolving Java programs. It takes the old and new versions of a program and a regression test suite as inputs, and then identifies affected tests-a subset of tests relevant to the program differences between the two versions and affecting changes-a subset of atomic changes relevant to the affected tests. It adapts spectrum-based fault localization techniques and applies them in tandem with an enhanced change impact analysis to identify and rank failure-inducing edits.
|
| Figure 1. FaultTracer overview |
Currently, FaultTracer toolkit has tested on Windows/Mac/Linux systems with:
The FaultTracer distribution mainly contain two parts: (1) the front-end plugin, which provides program edit extraction functionality, as well as friendly user interfaces; (2) the back-end library, which provides extended call graph (ECG) collection functionality, as well as core analysis of FaultTracer. The current version is under development and is upgraded frequently.
The installation of the FaultTracer toolkit is fairly simple:
1) Front-end: You can import the source code as an Eclipse project, and directly run it as eclipse application to start the plugin.
2) Back-end: You only need to set the
Before starting FaultTracer, the user would need to provide a configuration file, config.xml (named by the user), stored in the base directory of each program version under test:
In the file, "subject" shows the name of the version under test; "prefix" shows the common package name shared by the project; "testsuite" shows the fully qualified name for the main test suite class or a set of test classes separated by ":"; "newversion" shows the absolute path of the newer version compared with the current version; "junit4" is used to indicate whether the tests are in the junit4 format. Note that when you set a set of test classes in the "testsuite" property, the value should not be set (default is "true") even you have JUnit3 tests. "junit4" should only be set to "false" when you have set the "testsuite" property with a JUnit3 test suite; "faulttracer" provides the absolute path of the FaultTracer back-end; "cp" provides the class path needed for executing the program under test; finally, "maxmemory" provides the maximum memory allowed for executing FaultTracer (for the concern of performance, we suggest a value of greater than or equal to "1024m").
FaultTracer automatically extracts atomic changes between the version pair after the user right-clicks the two versions under test and select "Launch FaultTracer" (shown in Figure 2).
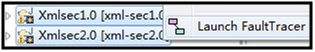 |
| Figure 2. Launch FaultTracer and extract program edits |
Then the user can also see the visualized atomic changes in the Atomic-Change View. All the FaultTracer views can be found in the following Eclipse path: "Window"->"Show View"->"Other"->"FaultTracer" (shown in Figure 3).
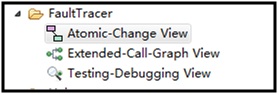 |
Figure 3. Opeb FaultTracer views |
Figure 4 illustrates the atomic changes between two versions of a real-world program. As shown in the figure, the user can search a specific graph node, apply and unapply a specific change, as well as change the graph organization (by right-clicking) easily. When the user click one change node, FaultTracer would highlight all the changes the selected change transitively depends on (shown as yellow nodes in Figure 4).
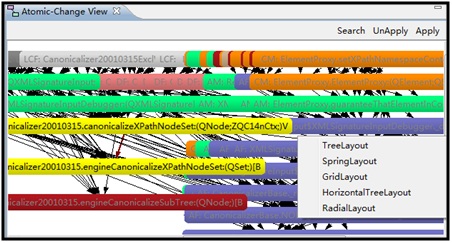 |
Figure 4. FaultTracer's atomic-change view |
When the user double click a specific change node, FaultTracer would show change details in the Java Editor. For example, Figure 5 illustrates the Java Editor content after the user double-clicks a change-method node.
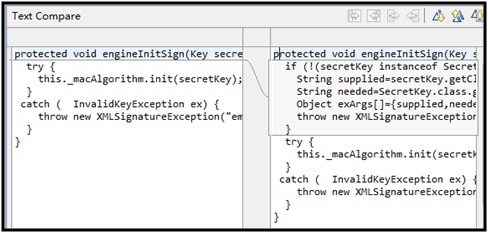 |
Figure 5. Detailed changes shown by FaultTracer |
The collection of ECGs has been implemented as an Ant task, the user can easily collect ECG coverage of program under test using the following command-line script:
cd path-of-program-to-trace
ant -f config.xml collectECGCoverage
which navigates to the base directory of the program under test, and then runs the Ant task collectECGCoverage. Then FaultTracer would automatically run the test suite for the program and record its ECG coverage for each test. The user can choose to see the visualized ECG coverage for each test in the Extended-Call-Graph View. Figure 6 illustrates the ECG for an example test, where the green node denotes the test, blue nodes denote meth- ods invoked, pink nodes denote field accessed, solid arrows denote method invocation, and dashed arrows denote field access. When the user click a node, FaultTracer would automatically highlight all the methods and fields transitively invoked or accessed by the node (shown as yellow nodes in Figure 6). The user can specify any test to display by clicking the "Choose Test" menu. The user can also specify to show the ECG on the old/new version of the chosen test via clicking "Old ECG"/"New ECG".
 |
Figure 6. FaultTracer's extended-call-graph view |
The selection of affected tests has also been implemented as an Ant task, the user can easily perform affected test selection using the following command-line script:
cd path-of-old-version
ant -f config.xml selectAffectedTests
which will select affected tests and store affected test handles in the new program version's FaultTracer files. Then the user can easily only run affected tests on the new version by simply using the following script:
cd path-of-new-version
ant -f config.xml runAffectedTests
The user can perform affecting change determination by the following script:
cd path-of-new-version
ant -f config.xml determineAffectingChanges
After the affecting change determination, the user can view the affecting changes for each affected tests in the Testing-Debugging View (shown in Figure 7). The left table in the view lists all the affected tests. When the user double-clicks an affected test in the left table, the view would display all the affecting changes for the test in the right table. Note that for this step, the view would not rank affecting changes. Also, the suspicious values and heuristic values for each affecting change would all be 0.
The user can perform affecting change ranking by the following script:
cd path-of-new-version
ant -f config.xml rankAffectingChanges
After the affecting change ranking, the user can view the ranked affecting changes for each affected tests in the Testing-Debugging View (shown in Figure 7). Note that for this step, the view would rank affecting changes and display the suspicious values and heuristic values for each affecting change.
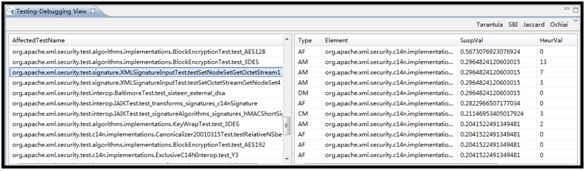 |
Figure 7. FaultTracer's testing-debugging view |
By Lingming Zhang,
Miryung Kim,
and Sarfraz Khurshid
Proceedings of the 27th IEEE International Conference on Software Maintenance
(ICSM 2011), pages 23--32, Williamsburg, VA, September 2011. [Download]
By Lingming Zhang,
Miryung Kim,
and Sarfraz Khurshid
Proceedings of the 20th International Symposium On the Foundations of
Software Engineering
(FSE 2012), to appear, Tool Demonstration Track, Cary, NC, November 2012. [Download]
By Lingming Zhang,
Lu Zhang,
and Sarfraz Khurshid
Proceedings of the ACM SIGPLAN Conference on Object-Oriented Programming Systems, Languages, and Applications
(OOPSLA 2013), to appear, 765--784, Indianapolis, IN , October 2013. [Download]
By Lingming Zhang,
Miryung Kim,
and Sarfraz Khurshid
Journal of Software Maintenance and Evolution
(JSME 2013), to appear, 2013. [Download]