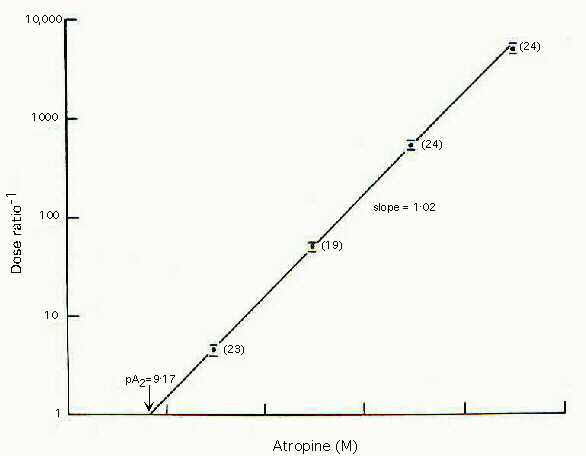
A Schild plot (based on the results of a student class practical on the effect of atropine on the contractile response of guinea-pig ileum to acetylcholine) is shown below. Note that the line is straight, and its slope close to unity, as the equation predicts.
(Fig 1-12)
Schild plot for the action of atropine in antagonizing the action of acetylcholine on guinea-pig ileum. Each point gives the mean plus or minus the standard error of the mean of the number of observations shown.