Receptor binding
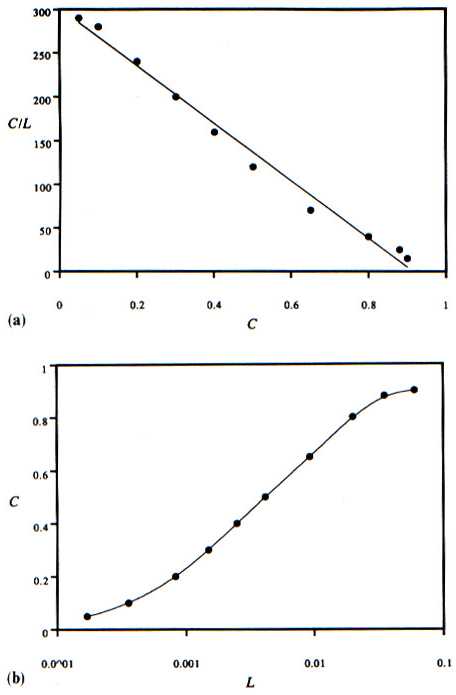
Figure 2-8. Equilibrium receptor binding data. (a) In a Scatchard plot of the data, the ratio of bound ligand concentrations is plotted versus the bound ligand concentration. (b) The same data are plotted in the form of bound ligand concentration versus free ligand concentration. Note that at high free ligand concentration receptor saturation is approached. These data are for benzodiazepine binding to rat brain cells. Redrawn from Klotz (1985).