As discussed in Sec. 2.4
a principal reason for
adopting a kinetic-level model is the desire to evaluate the
time-evolution of an irreversible system. Again, this has been
demonstrated using open-system Wigner-function models
(Ravaioli et al., 1985; Frensley, 1986, 1987a; Kluksdahl et
al., 1988).
As an example, let us consider abruptly
changing the bias voltage on the model RTD. Then the Wigner function
f will initially equal the steady-state value at the first bias
voltage. After the voltage is changed, f will evolve and approach the
steady-state value at the new bias voltage. This time evolution may be
evaluated by integrating (4.51), now regarding the
potential as a time-dependent quantity. The integration with respect to
t is readily done by discretizing t in units  . For purely
numerical considerations of stability (see Frensley, 1987a),
an effective way to implement the
time integration is using the ``fully implicit'' or ``backward Euler''
approach, which involves repeatedly solving
. For purely
numerical considerations of stability (see Frensley, 1987a),
an effective way to implement the
time integration is using the ``fully implicit'' or ``backward Euler''
approach, which involves repeatedly solving

to advance the solution for  forward in time. This is equivalent
to expanding the exponential of the Liouville operator in a product
expansion:
forward in time. This is equivalent
to expanding the exponential of the Liouville operator in a product
expansion:

Note that, because  is not Hermitian,
  is not
unitary. It is thus not necessary to use the unitarity-preserving Cayley (or
Crank-Nicholson) form:
is not
unitary. It is thus not necessary to use the unitarity-preserving Cayley (or
Crank-Nicholson) form:

which is preferred for the integration of Schrödinger's equation. The fully implicit scheme is a bit simpler to implement (and to explain) than the Cayley scheme, but the latter will generally be more accurate (see Jensen and Buot, 1989a), and probably should be preferred.
The transient response calculation was done (using the fully implicit scheme) for the particularly interesting case of the RTD being suddenly switched across the negative-resistance region. The spatially averaged current density (which would equal the current induced in the external circuit, apart from parasitic effects) is plotted in Fig.\ 15.
Figure 15. Results of a calculation of the transient response of the resonant-tunneling diode. For t<0 the device was in steady state atV, the peak of the
curve of Fig. 11. At t=0 the voltage was switched to
V, the bottom of the valley. The conduction current density averaged over the device (which equals the current induced in the external circuit) is plotted as a function of t. The current initially increases and then declines with some superimposed oscillations toward the new steady state. Parasitic effects are neglected.
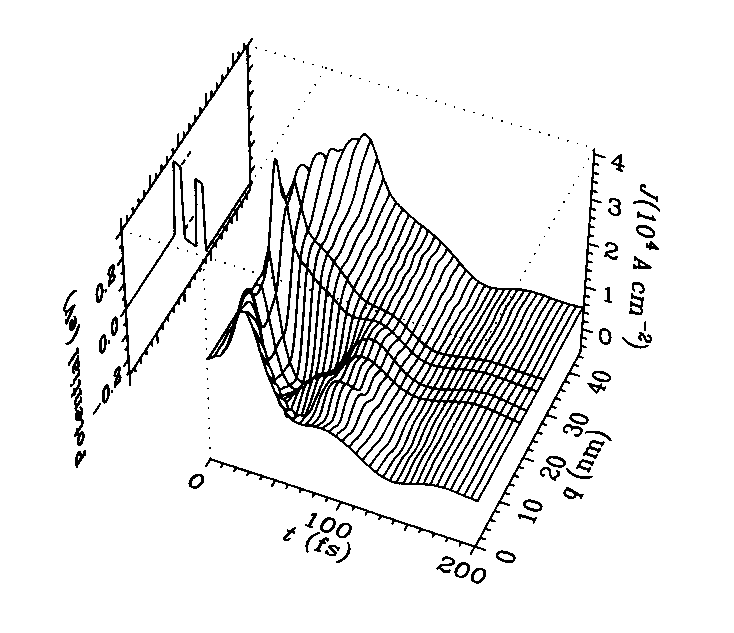
The current initially rises in response to the increased field and then decreases toward its steady-state value with some superimposed oscillations. More insight can be gained into the transient process by plotting the current density as a function of both time and position within the device as in Fig. 16. There is an initial peak within the quantum well which reflects the shifting electron distribution in response to the increased field. The current density in the downstream part of the device then declines fairly monotonically, presumably reflecting a simple single-barrier tunneling process which empties the quantum well. On the upstream side of the structure the current transient is much more oscillatory. The reason for this is presumably the change in reflection coefficient caused by the shift in the potential and the resulting transient changes in the standing-wave patterns in this region. The most significant result of the calculation, however, is the demonstration of a stable approach to steady state.
Figure 16. The same transient-response calculation as that shown in Fig. 15, but here the current density is shown as a function of position q within the device.