


Modeling
Reasoning
Implementation
User Guide
Reasoning
© 2008-
Quantitative Reasoning
The RE-
The following is an example of the weight-

In this example, user-
Let’s look at the example above in more detail. Suppose we use the following weight
assignments with values between 0.0 and 1.0 for different priorities (high, medium
and low) and different contributions (Make/++, SomePlus/S+, Help/+, Hurt/-

Using the pre-

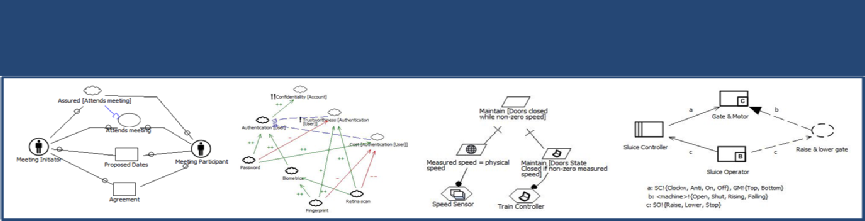
Notice the contribution link towards Biometrics is a solid line while the contribution links towards Trustworthiness and Cost are dashed lines. A solid line represents the contribution between a solution and its goal while a dashed line represents a correlation between a solution and one other goal.
Based on the weight assignment table, the following table shows the individual, cumulative score for all correlation links (against Trustworthiness and Cost), and the total cumulative score for the Retina scan option against the three selection criteria.
The individual score for each contribution is displayed over the contribution labels
(0.2 for Make(Biometrics), 0.5 for Make(Trustworthiness) and -
Comparing the cumulative score of 0.5 against 0.35 for the Fingerprint option, RE-

Next step is to calculate the score for the Biometrics option for a comparison against the Password options. The total cumulative score is arrived from the following scores:
The reason the correlation scores for the Retina scan option are also included even Biometrics does not have any explicit correlation links with the two other criteria is that Biometrics represents the selected child option at the abstract option level. Otherwise, Biometrics would be an option that does not have any correlation with other criteria.
–
This page in Latvian (by Lucja Adamska)
|
Option |
Criterion/Weight |
Contribution/Weight |
Score |
|
Retina scan |
Biometrics/0.2 |
Make/1.0 |
1.0 x 0.2 = 0.2 |
|
Retina scan |
Trustworthiness/0.5 |
Cost/0.2 |
1.0 x 0.5 = 0.5 |
|
Retina scan |
Cost/0.2 |
Break/- |
- |
|
|
|
Cumulative Correlation Score |
0.5 - |
|
|
|
Total Score |
0.2 + 0.5 - |
|
Option |
Criterion/Weight |
Contribution/Weight |
Score |
|
Biometrics |
Authentication/0.2 |
Make/1.0 |
1.0 x 0.2 = 0.2 |
|
Retina scan |
Trustworthiness/0.5 |
Make/1.0 |
1.0 x 0.5 = 0.5 |
|
Retina scan |
Cost/0.2 |
Break/- |
- |
|
|
|
Cumulative Correlation Score |
0.5 - |
|
|
|
Total Score |
0.2 + 0.5 - |